Performance monitoring is easy when your app behaves the same way for everyone. One deployment, one dataset, one story. But most apps are not like that.
If your product serves multiple customers or organizations, performance is not a single number. One organization may be flying through your dashboard while another is grinding to a halt. One route may be the culprit, or it may only be a problem for a specific customer on that route. These are very different problems and they require different lenses to diagnose.
This is why Witnes offers three distinct ways to drill into your performance data.
The Default: The Whole App
The Performance view, by default, gives you the full picture across all users and all routes — Good/Needs Improvement/Bad ratios, load time percentiles (p50, p70, p90, p95), and a mean load time trend over time. This is the right starting point for spotting whether your app is trending in the wrong direction overall.
But averages lie. A p50 of 500ms can hide an organization where every session is sitting at 2 seconds.
Lens 1: By Organization
When a customer contacts support and says your app is slow, the first instinct is often to pull up the global view and see nothing obviously wrong. That is because globally, things may be fine.
Filtering by organization narrows the entire performance view — scores, percentiles, trend chart, and route breakdown — down to sessions belonging to that specific org. You immediately see whether their experience tracks with the rest of your users or whether something is clearly off for them.
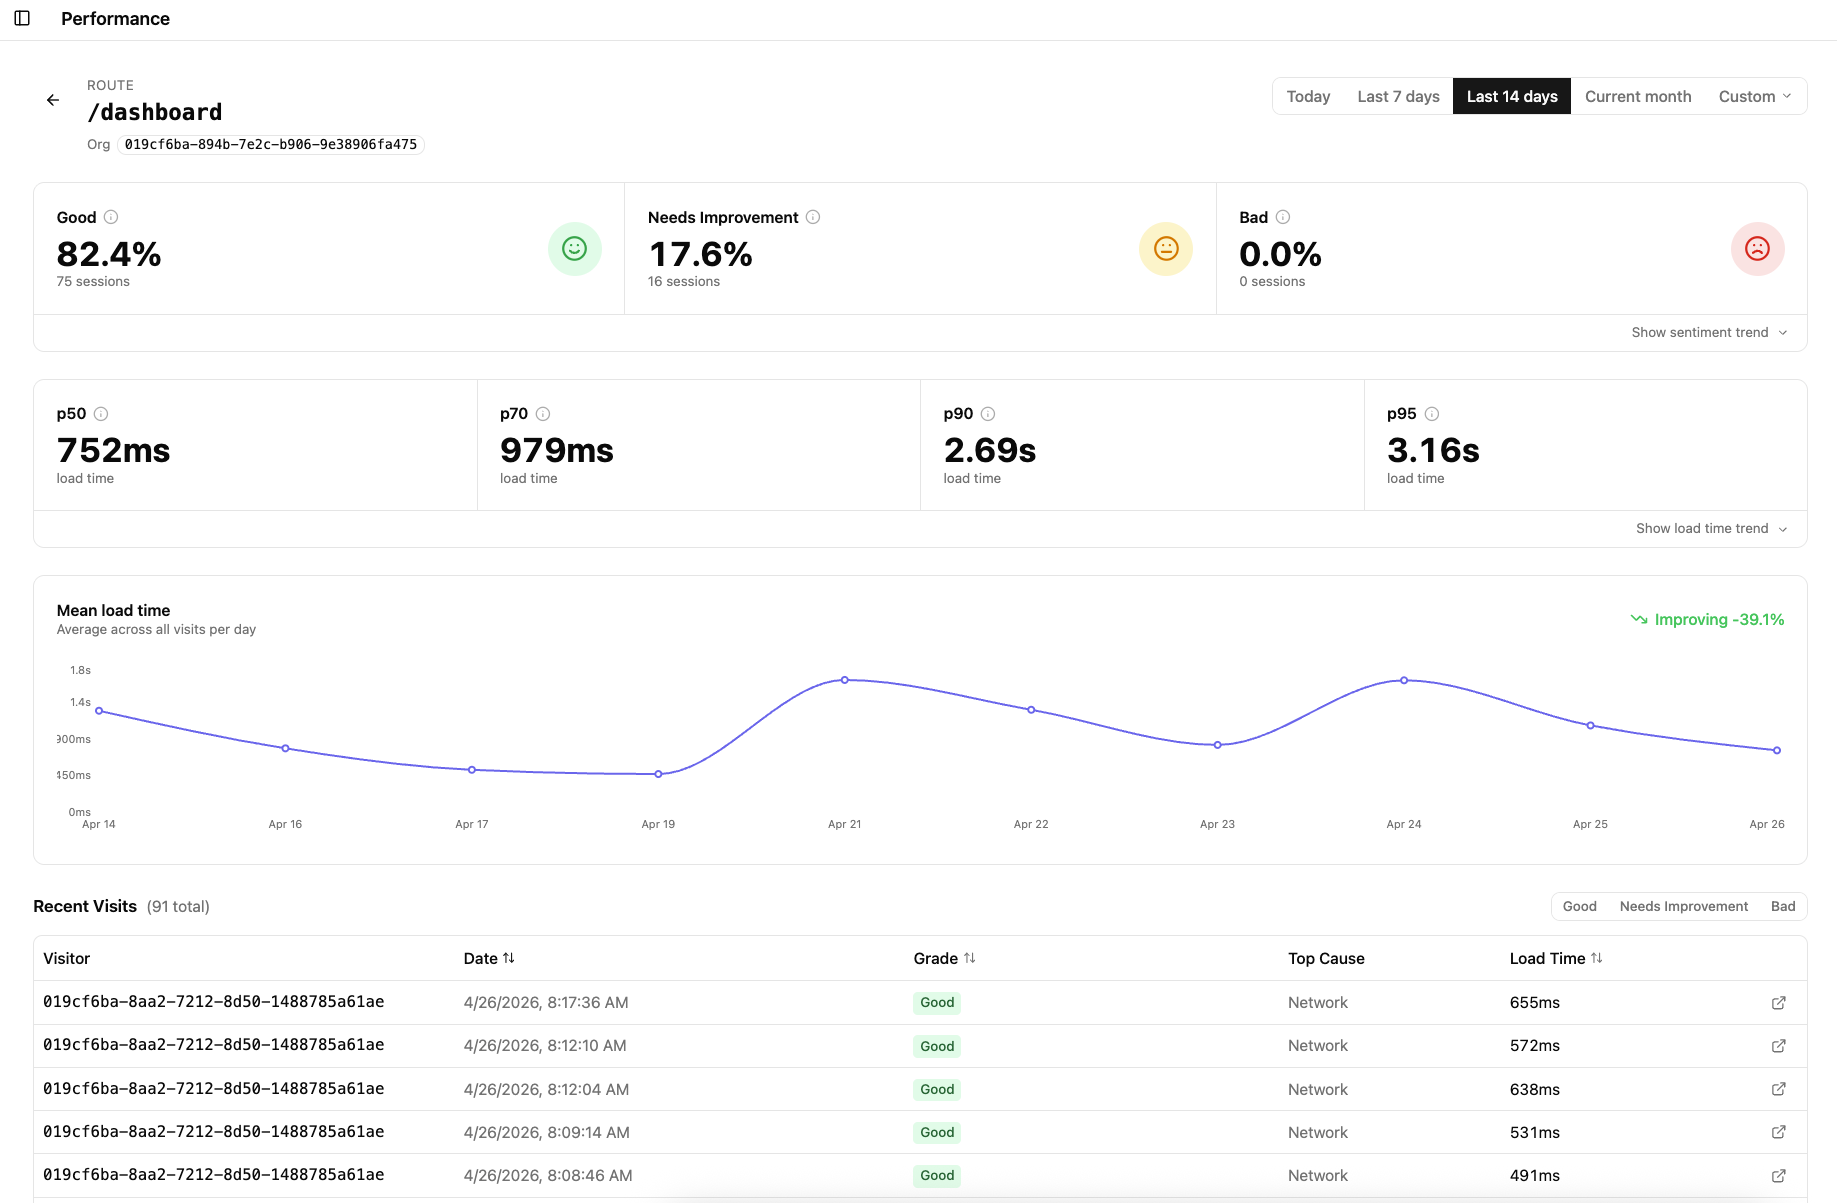
This view also surfaces a per-route breakdown within that organization, so you can see whether the problem is app-wide for them or isolated to specific pages. If their /dashboard is showing 17.6% Needs Improvement while /settings is 100% Good, the conversation with that customer becomes a lot more specific.
Lens 2: By Route
Sometimes the complaint is not about a customer — it is about a page. “The dashboard is slow.” “Checkout feels sluggish.” When that happens, you want to look at a single route across all users, not all routes for one user.
Filtering by route shows the health of that specific page across your entire user base: sentiment scores, load time percentiles, the mean load time trend, and a list of recent individual sessions with grade, top cause, and exact load time. That last part matters — you can drill into real visits rather than just aggregates.
A p50 of 784ms but a p95 of 3.09s tells a story of a route that behaves well most of the time but has a long tail worth investigating. You would never see that story in a global average.
Lens 3: By Organization and Route Together
This is where things get precise. Filtering by both an organization and a route answers a very specific question: is /dashboard slow for this particular customer?
The numbers here will almost always differ from both the all-users route view and the all-routes org view. You are no longer asking whether the route is generally slow, or whether the org is generally having a bad time — you are looking at the intersection. Same route, same customer, isolated.
In the example above, /dashboard across all users sits at 84.3% Good. The same route filtered to a specific organization sits at 82.4% Good with a noticeably higher p70 and p95. The difference is not dramatic here, but in a real support or debugging scenario that delta is exactly what you need to confirm — or rule out — that a customer’s experience is an outlier driven by their specific data or usage pattern.
Why This Matters for Variable-Data Apps
Apps where data volume, query complexity, or usage behavior varies significantly between customers will naturally produce variable performance. That is expected. What is not acceptable is having no way to distinguish between “this route is universally slow” and “this customer’s data makes this route slow for them.”
These three lenses give you the ability to have that conversation clearly. When a customer escalates, check their org. When the team suspects a route is the bottleneck, isolate it globally. When both suspicions are live at the same time, combine them and get an exact answer.
Each of these views is a shareable URL. You can drop the org-filtered link into a support thread, or post the org+route URL into a Slack incident channel while debugging. The context travels with the link — no need to describe which filters you applied.